02TÜBİTAK 2209-A · Research
Reading a materialfrom its heat.
The same laser pulse leaves six different heat traces on six materials. A model that recognises them can support choosing the energy per material.
- Programme
- TÜBİTAK 2209-A · funded, completed
- My role
- Project lead · ML / CV
- Model
- DualViT-CNN + ArcFace
- Publication
- Gazi Univ. J. Sci. Part A · 2026
My contribution
I was the project lead; we were a team of three with one advisor. The machine learning and computer vision work was mine: data preparation and preprocessing, designing and training the DualViT-CNN + ArcFace model, and comparing and evaluating it against classical models. The ANSYS simulations were team work.
01Problem
One pulse, six different traces.
When PCBs are processed with a femtosecond laser at one fixed energy density (fluence), one material receives more energy than it needs and another too little. Materials carry heat very differently: their thermal conductivities differ by about four orders of magnitude.
The study turns the thermal response of aluminium, copper, FR-4, graphene, PTFE and titanium under the laser into images by simulation, and builds a model that recognises the material from that image. Once the material is known, the energy can be chosen for it.
Two similar traces
FR-4 and PTFE conduct heat almost equally poorly (0.29 and 0.25 W/m·K); in both, the trace stays in a small spot. They are also, more often than not, the pair the models confuse most.

Aluminium
Thermal conductivity237 W/m·K

Copper
Thermal conductivity385 W/m·K
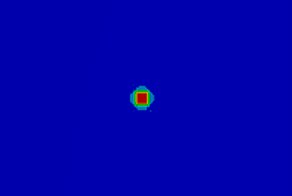
FR-4
Thermal conductivity0.29 W/m·K

Graphene
Thermal conductivity5,300 W/m·K
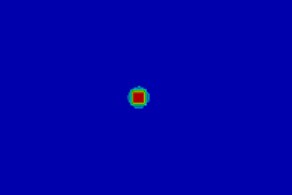
PTFE
Thermal conductivity0.25 W/m·K
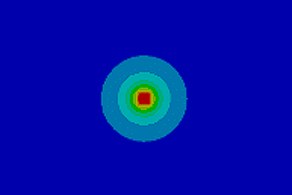
Titanium
Thermal conductivity22 W/m·K


02Data
From simulation to dataset.
A thermal analysis in ANSYS for every material and board standard, then one uniform image the model can read.
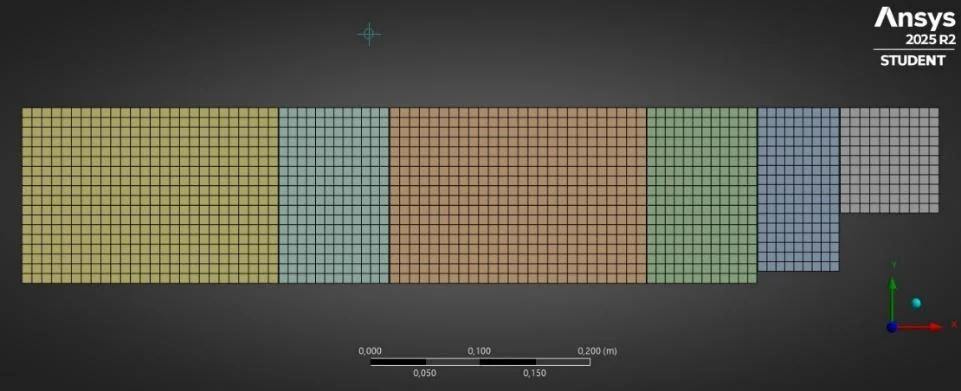
The mesh for the board standards in ANSYS (report, Figure 2).
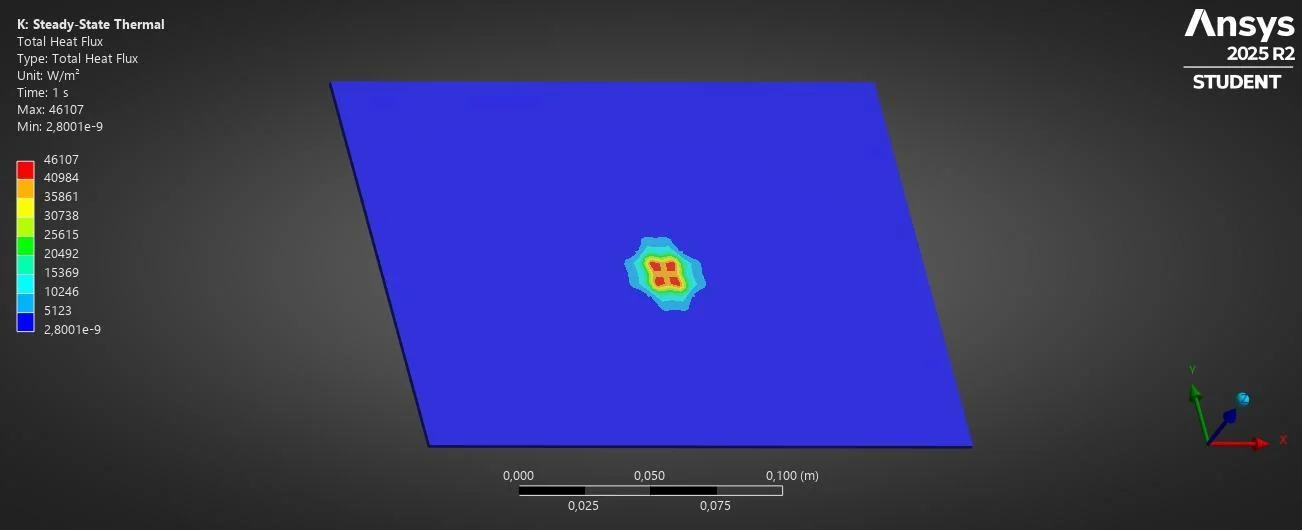
Steady-state thermal analysis on a titanium VME 6U board (report, Figure 3).
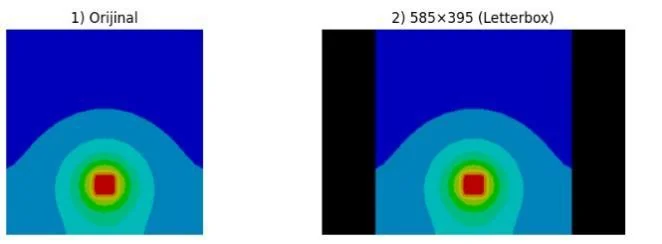
The original image and its 585 × 395 fitted version (report, Figure 6).
![The same image converted to grey and normalised to the [0, 1] range.](/media/research/prep-gray.webp)
Greyscale conversion and [0, 1] normalisation (report, Figure 7).
The steady-state analysis set a constant 100 °C surface temperature and h = 10 W/m²K convection on the edges; the transient analysis modelled the laser pulse as a Gaussian heat source and solved 0–5 ms. Corrupted, saturated or misplaced outputs were removed: 736 images.
I prepared the images for the model: fitting them to 585 × 395 pixels with the aspect ratio kept and zero padding, converting to grey so the model could not memorise the colour map, and normalising to [0, 1]. For the classical models I extracted a 256-bin intensity histogram from every image.
Augmentation was applied to the training set only: horizontal flips and ±15° rotations, taking the set from 736 to 2,208 samples.
The ANSYS simulations were team work; turning the images into a dataset and preprocessing them was mine.

Augmentation examples
- Original

- Rotation

- Rotation



03Model
Two views, one signature.
A CNN for local texture, a Vision Transformer for the whole image, and a cross-attention layer that joins them.
The CNN branch (ResNet-18, pretrained on ImageNet) captures the local temperature gradients and small textures the laser leaves. The ViT branch learns relations between distant parts of the image: how the heat spreads across the surface.
In the cross-attention fusion, CNN tokens act as queries and ViT tokens as keys and values, so a local hot spot is read together with the distribution over the whole surface. For classification, ArcFace adds an angular margin between classes, which helps separate close materials such as FR-4 and PTFE.
According to the report’s ablation summary, removing the cross-attention layer caused the largest drop, and using Softmax instead of ArcFace increased confusion between similar materials. The summary is not backed by repeated-run logs.
Softmax
ArcFace
04Results
Where are the mistakes made?
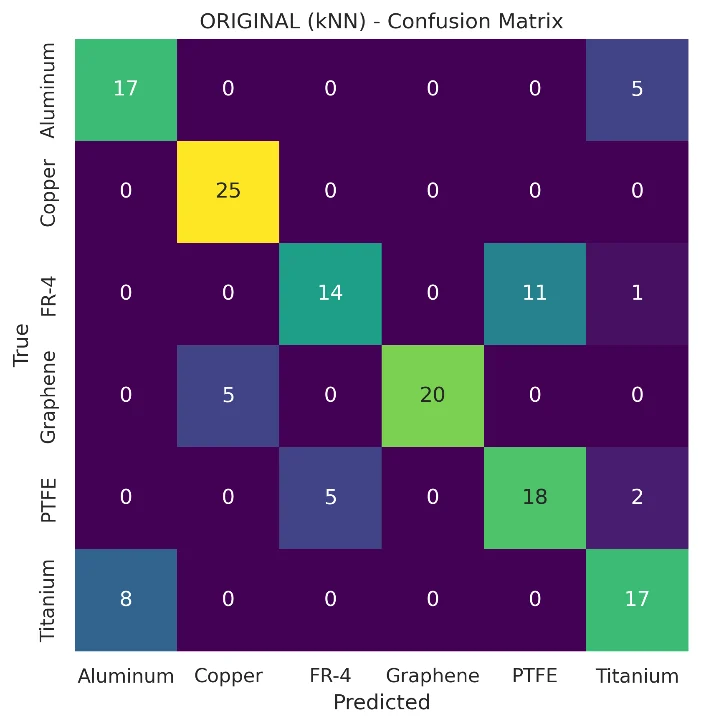
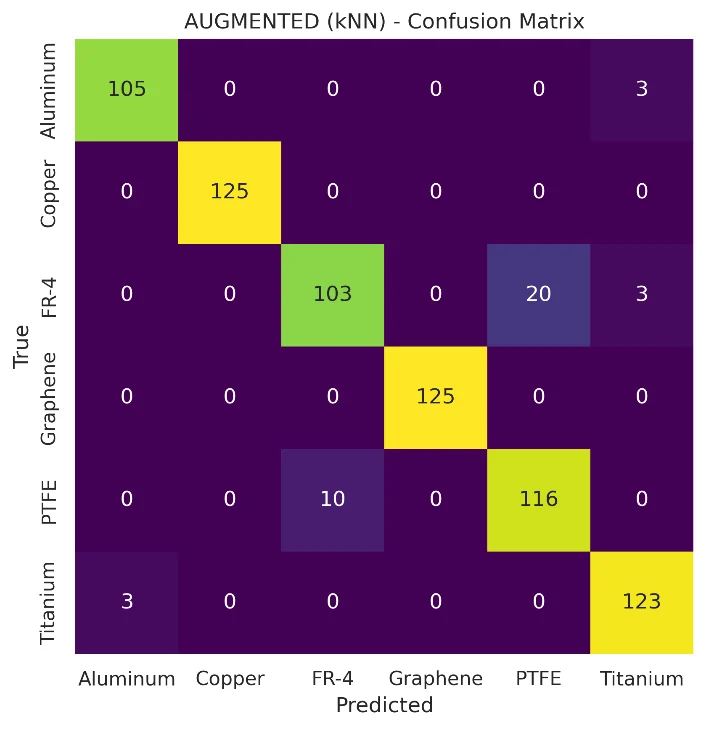
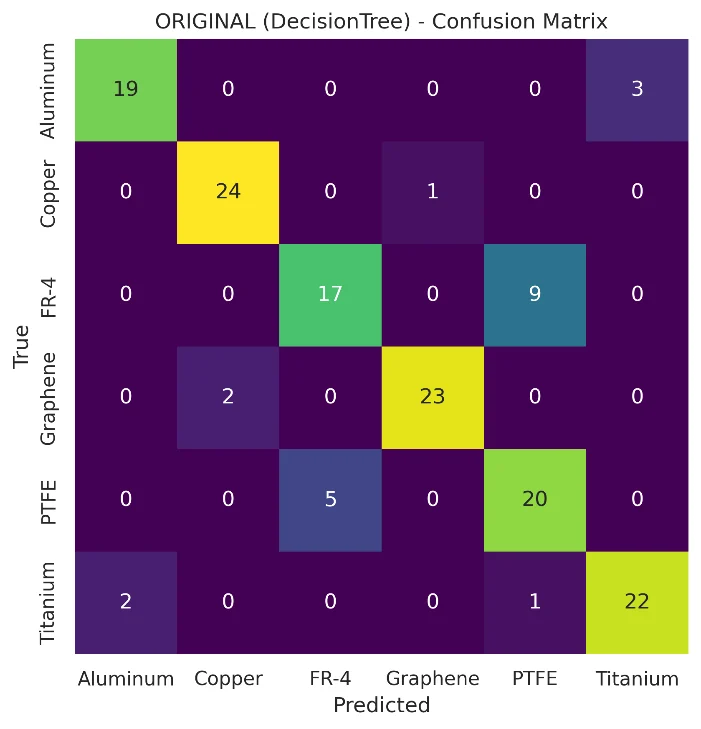
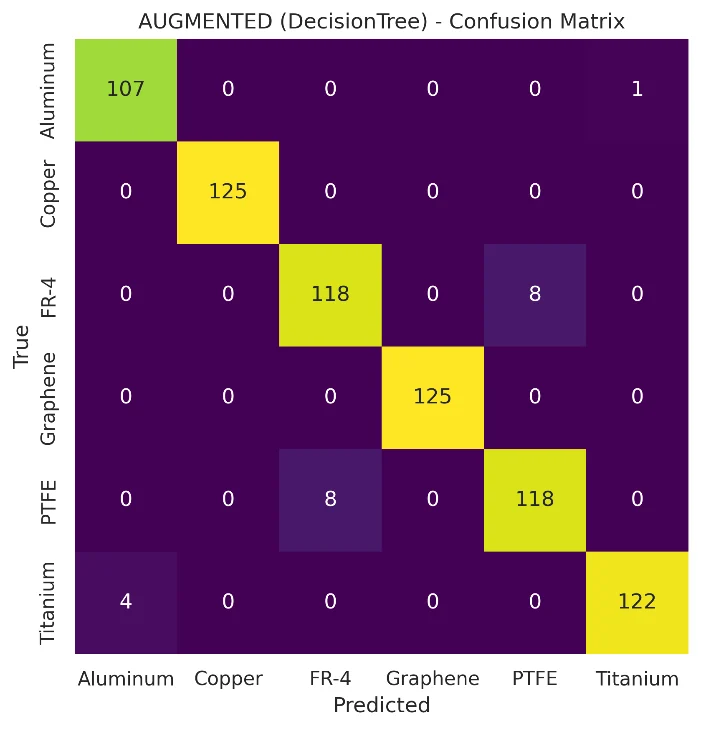
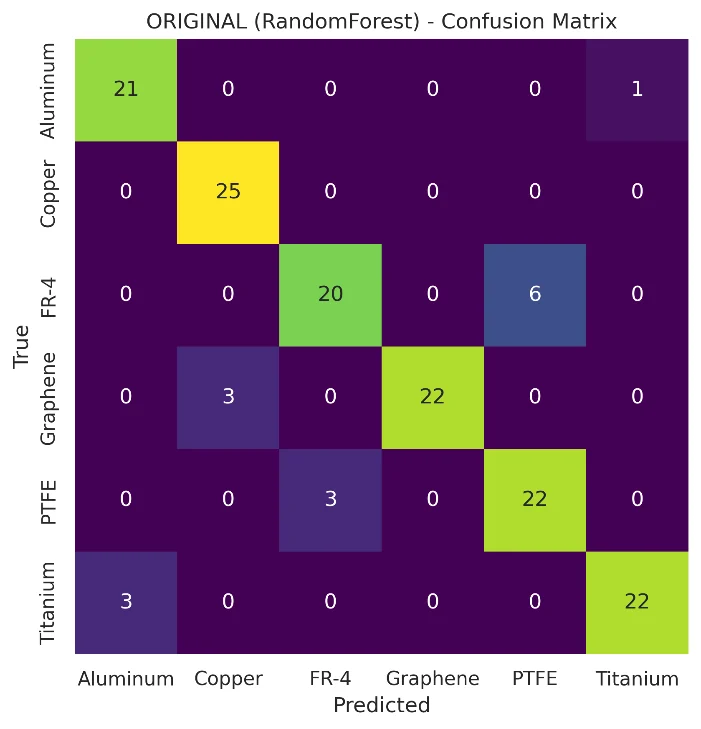
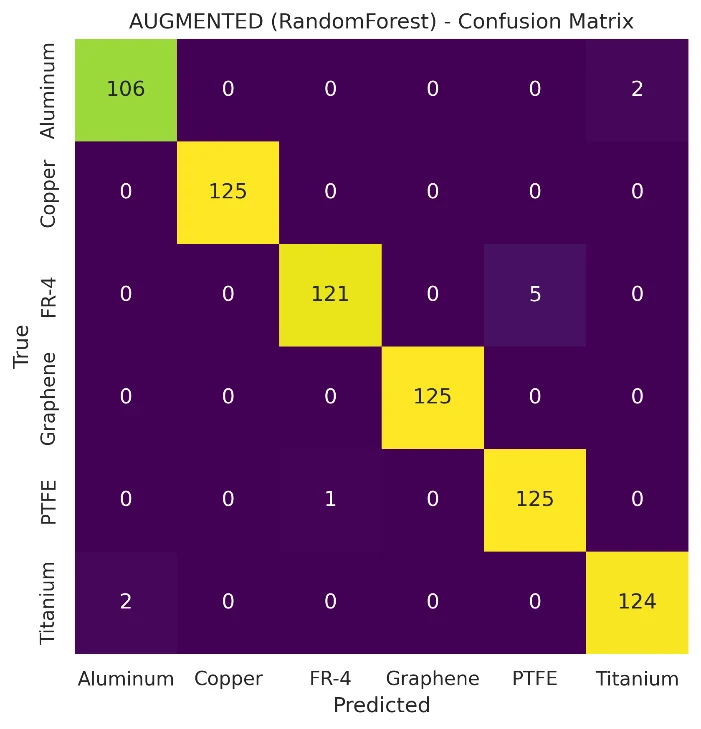
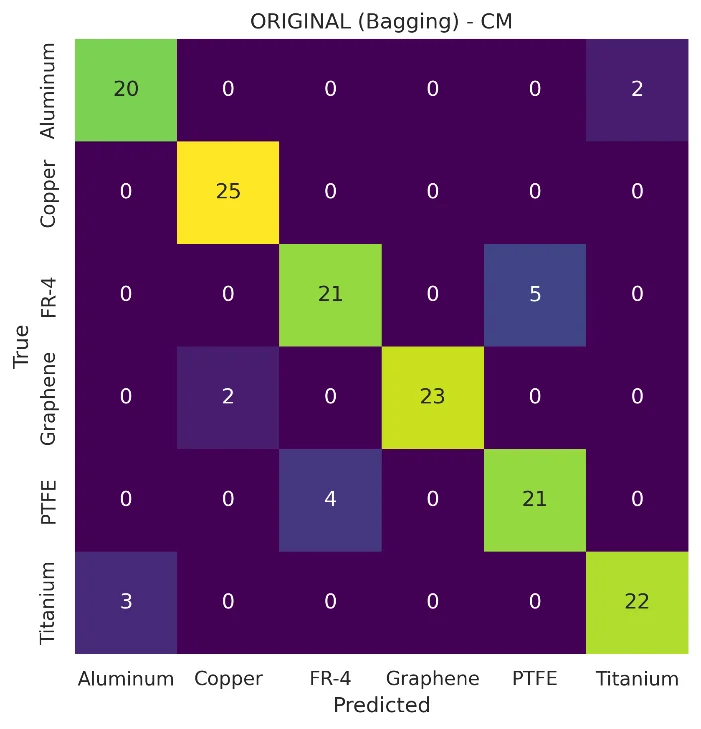
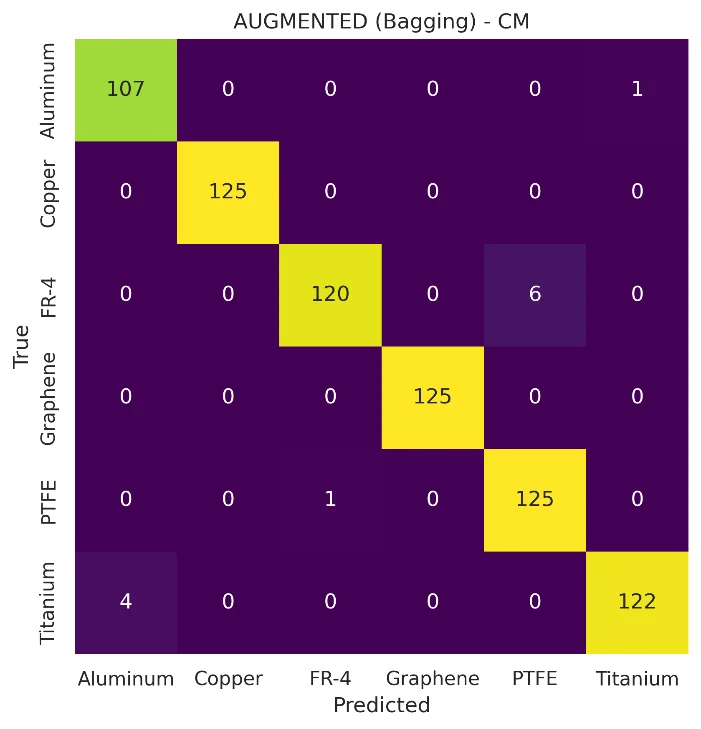
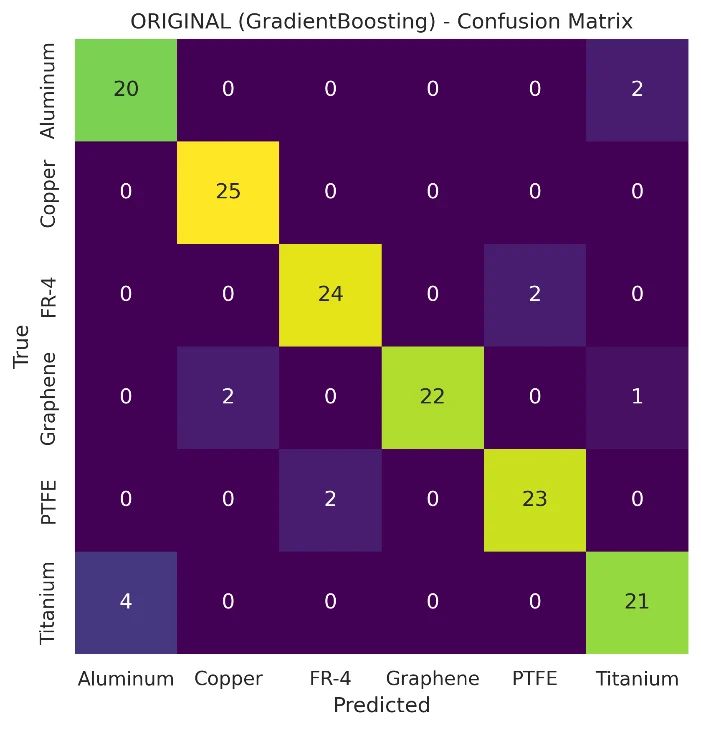
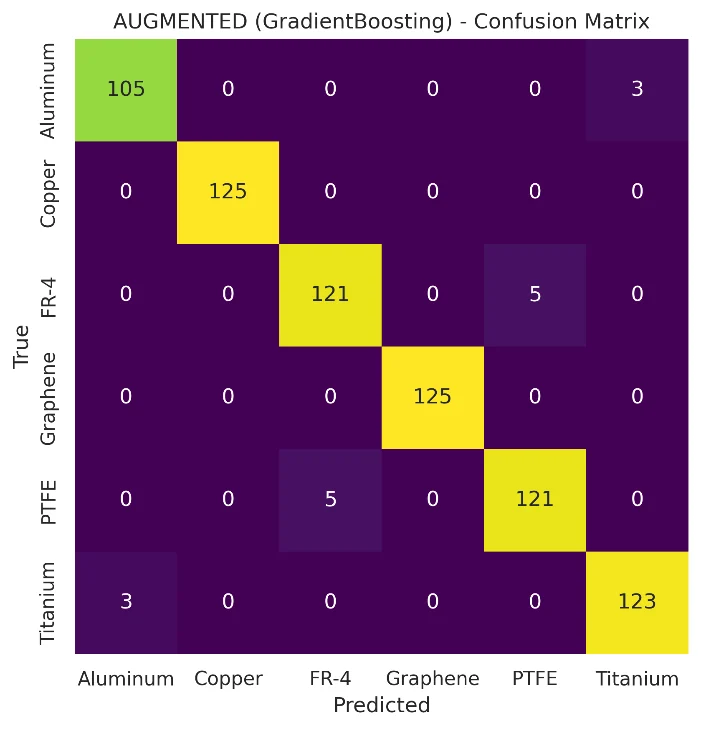
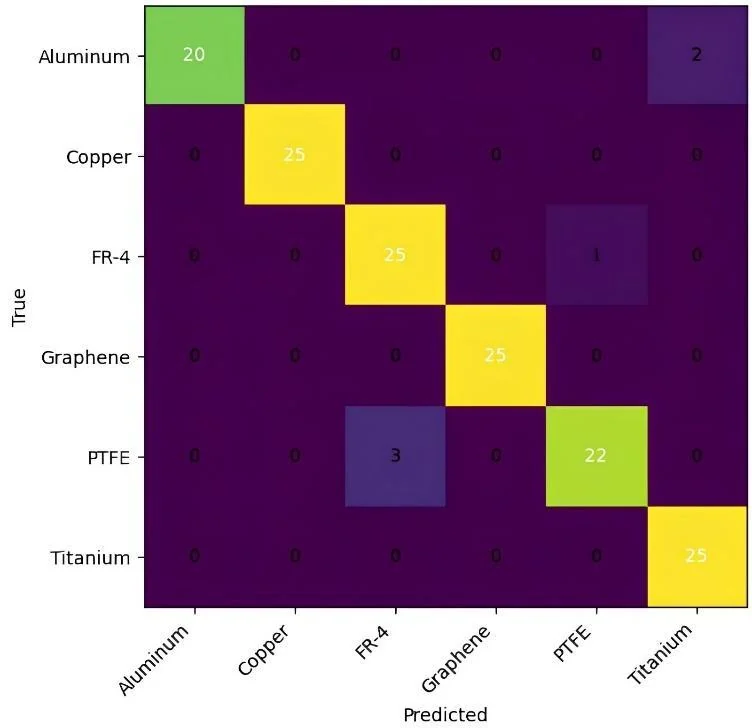
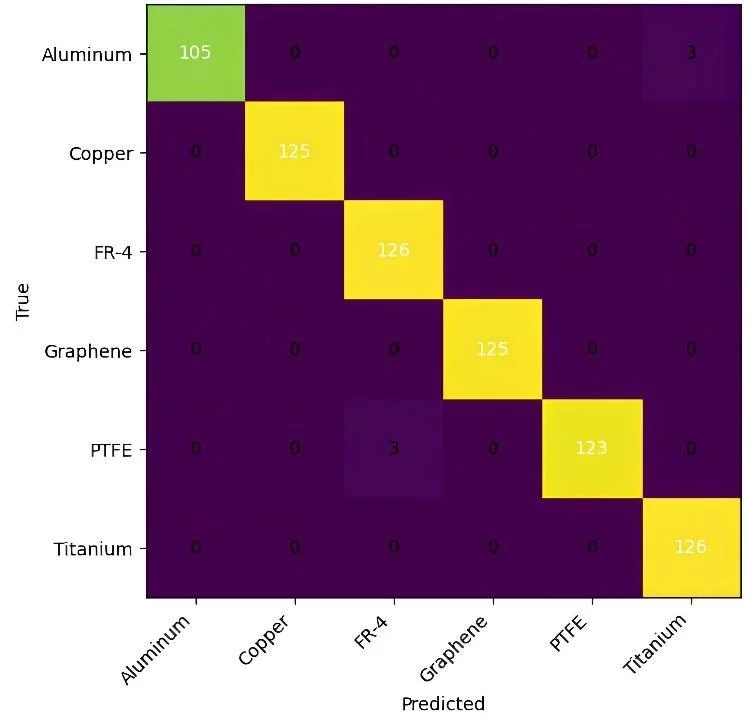
Six models, two data set-ups. The hybrid model was the most accurate in both; in both, its mistakes fell on the same two pairs: PTFE and FR-4, aluminium and titanium.
| Model | Accuracy | F1 (macro) |
|---|---|---|
| kNN | 75.00% | 74.84% |
| Decision tree | 84.46% | 84.65% |
| Bagging | 89.19% | 89.23% |
| Random forest | 89.19% | 89.26% |
| Gradient boosting | 91.22% | 91.12% |
| DualViT-CNN + ArcFace | 95.95% | 95.94% |
| Model | Accuracy | F1 (macro) |
|---|---|---|
| kNN | 94.70% | 94.74% |
| Decision tree | 97.15% | 97.17% |
| Bagging | 98.37% | 98.36% |
| Random forest | 98.64% | 98.63% |
| Gradient boosting | 97.83% | 97.82% |
| DualViT-CNN + ArcFace | 99.18% | 99.17% |
| Al | Cu | FR-4 | Gr | PTFE | Ti | |
|---|---|---|---|---|---|---|
| Al | 20 | 0 | 0 | 0 | 0 | 2 |
| Cu | 0 | 25 | 0 | 0 | 0 | 0 |
| FR-4 | 0 | 0 | 25 | 0 | 1 | 0 |
| Gr | 0 | 0 | 0 | 25 | 0 | 0 |
| PTFE | 0 | 0 | 3 | 0 | 22 | 0 |
| Ti | 0 | 0 | 0 | 0 | 0 | 25 |
| Al | Cu | FR-4 | Gr | PTFE | Ti | |
|---|---|---|---|---|---|---|
| Al | 105 | 0 | 0 | 0 | 0 | 3 |
| Cu | 0 | 125 | 0 | 0 | 0 | 0 |
| FR-4 | 0 | 0 | 126 | 0 | 0 | 0 |
| Gr | 0 | 0 | 0 | 125 | 0 | 0 |
| PTFE | 0 | 0 | 3 | 0 | 123 | 0 |
| Ti | 0 | 0 | 0 | 0 | 0 | 126 |
With the original data, 6 of 148 images were wrong: 3 PTFE images taken for FR-4, 1 FR-4 image for PTFE, and 2 aluminium images for titanium.
With the augmented set-up, 6 of 736 images were wrong: 3 PTFE images taken for FR-4 and 3 aluminium images for titanium.
The two set-ups were evaluated on different sets (148 and 736 images). The augmented result should not be read as a direct improvement on the original one; images derived from the same simulation resemble each other.
05Energy
The right material, the energy it needs.
The fixed approach processes every board at copper’s high threshold. Once the material is known, low-threshold boards need less.
The fixed reference fluence is 0.40 J/cm². With model-based selection, the average fluence set by the classified material is ≈0.209 J/cm² in the original set-up and ≈0.211 J/cm² in the augmented one: in theory, about 47% less energy.
The riskiest mistake is PTFE taken for FR-4, which can apply too little energy. The report proposes a simple feedback rule: if no effect is seen after an FR-4 prediction, one 0.30 J/cm² correction pulse is fired at the same spot. The estimated saving then falls from 47.2% to 46.9%.
Fixed reference
0.400
Model · original
0.209
Model · augmented
0.211
≈ 47% theoretical saving

The saving is a theoretical estimate based on simulation; there is no physical laser experiment or measured energy consumption. The article itself describes the approach as preliminary decision support.
06Publication
From a project to an article.
- 01
TÜBİTAK 2209-A
The project was funded and completed (8 April 2025 – 3 January 2026). I was its lead.
- 02
Publication
The work was published as an article in Gazi University Journal of Science Part A (2026).
- 03
Model
DualViT-CNN + ArcFace: 95.95% accuracy and 95.94% F1 on the original data.
- 04
Scope
Simulation-based classification and a theoretical energy estimate; physical validation is the next step.
Article
Özel Y., Vall M. M., Yıldırım M. A., Balcı H. Ş., Balcı F., Ilgın H. A. AI-Assisted Thermal Response Classification of PCB Materials for Energy-Efficient Femtosecond Laser Processing: A Simulation-Based Study. Gazi University Journal of Science Part A: Engineering and Innovation, 13, 1–19 (2026).
Team: three people and one advisor. The article has six authors; the author order follows the official record.