05TÜBİTAK RUTE · 3D data
From pointsto meaning.
Separating the railway environment point by point. A study connecting data exploration, model choice, predictions and visible errors.
- Data
- Rail3D · HMLS
- Processing
- Open3D
- Model
- 3DMASC + LightGBM
My contribution
I prepared the point clouds and carried out model experiments, feature extraction, classification and result visualization.
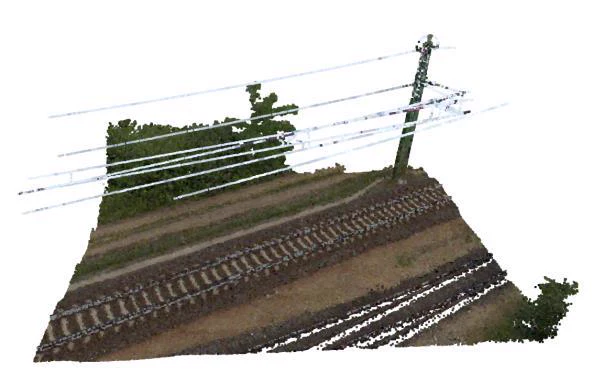
01Point clouds
Dense data. Fine structures.
Rails, ground and vegetation share the same cloud. Fine structures such as wires are more sensitive to point density.
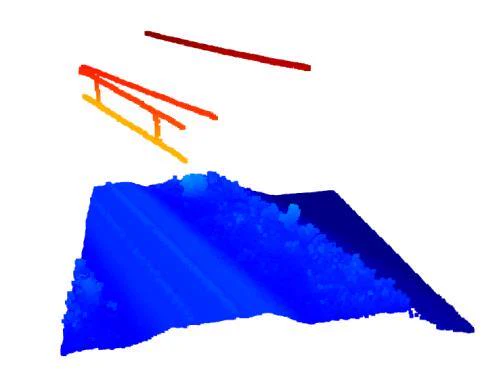
I used the HMLS subset of Rail3D. With Open3D, I explored the data from different angles, tried filtering and cropping, and examined how sampling choices affect its structure.
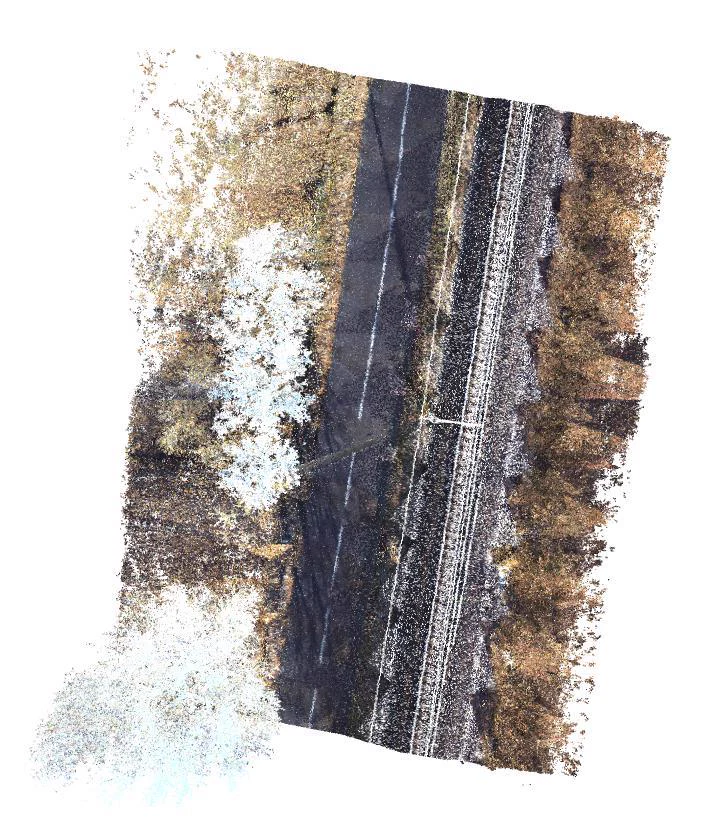
Data: Rail3D — Kharroubi and colleagues; Hungarian MLS — Mate Cserep (2022), Version 1, DOI: 10.17632/ccxpzhx9dj.1.
Rail3D · Hungarian MLS · CC BY-NC 3.0
Prediction and error overlays are outputs of my internship work. Images were re-encoded for the web, and comparison panels were cropped separately. Raw data is not distributed.
02Choosing a method
Preserve the structure first.
Data preparation matters alongside the model. The limits of early experiments informed the next approach.
- 01
Exploring with Open3D
I examined point density, cropping, filtering and geometric processing to understand the data.
- 02
A PointNet experiment
Aggressive downsampling removed information from wires and other fine structures. I examined sampling choices and class confusion.
- 03
3DMASC + LightGBM
I extracted geometric features at multiple scales and worked on classification with LightGBM.
- HMLSPoint cloud
- ExploreOpen3D
- SampleData preparation
- FeaturesMulti-scale 3DMASC
- LightGBMClassification
- PredictClass colors
- Analyze errorsIncorrect points
03Actual outputs
Make errors visible too.
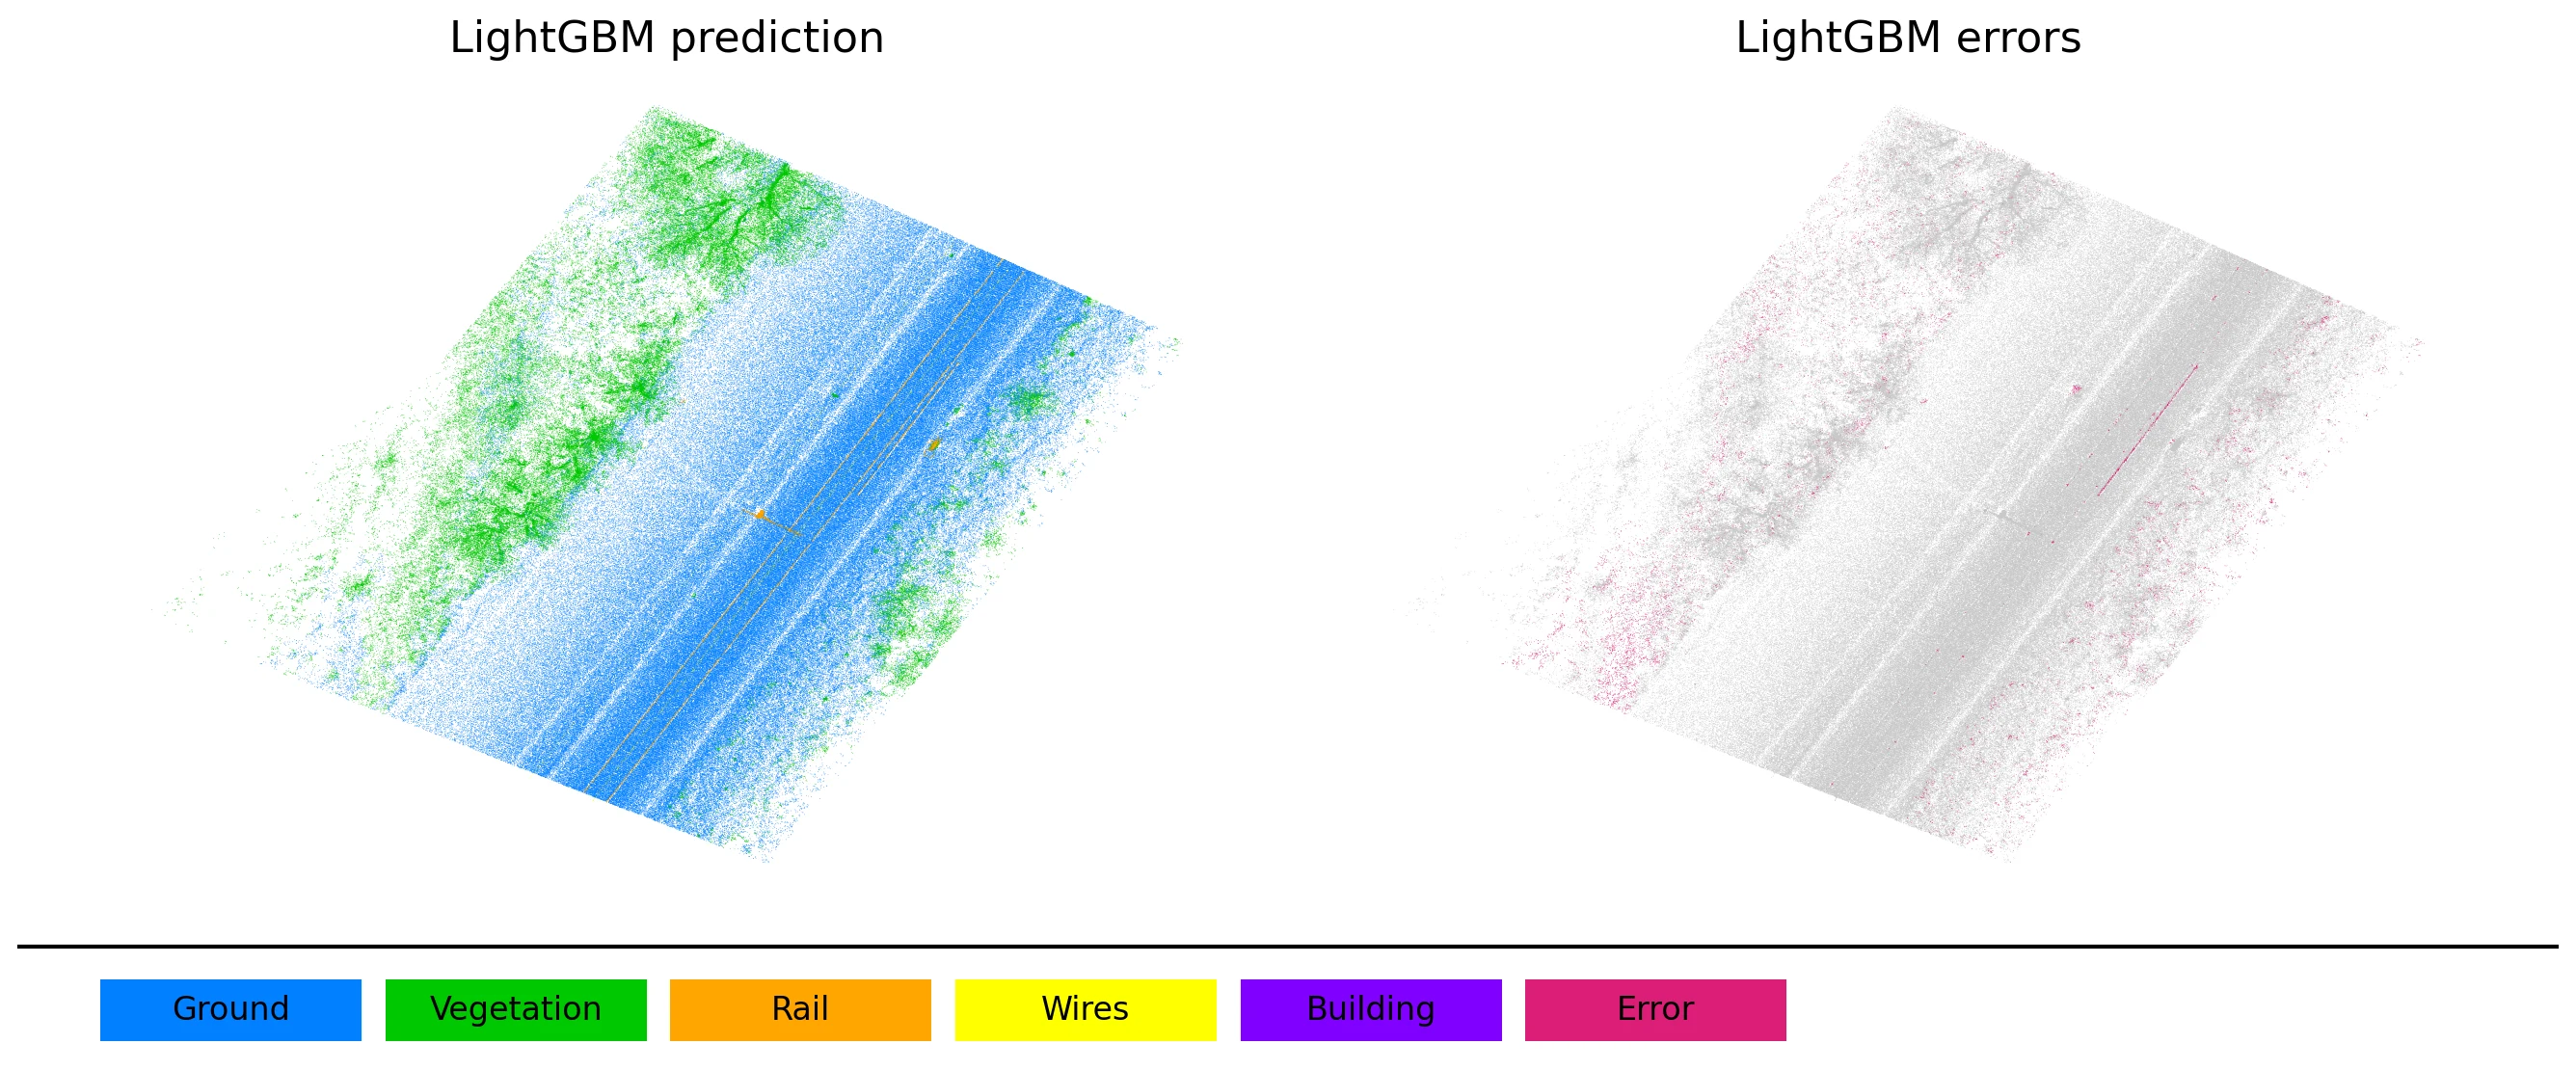
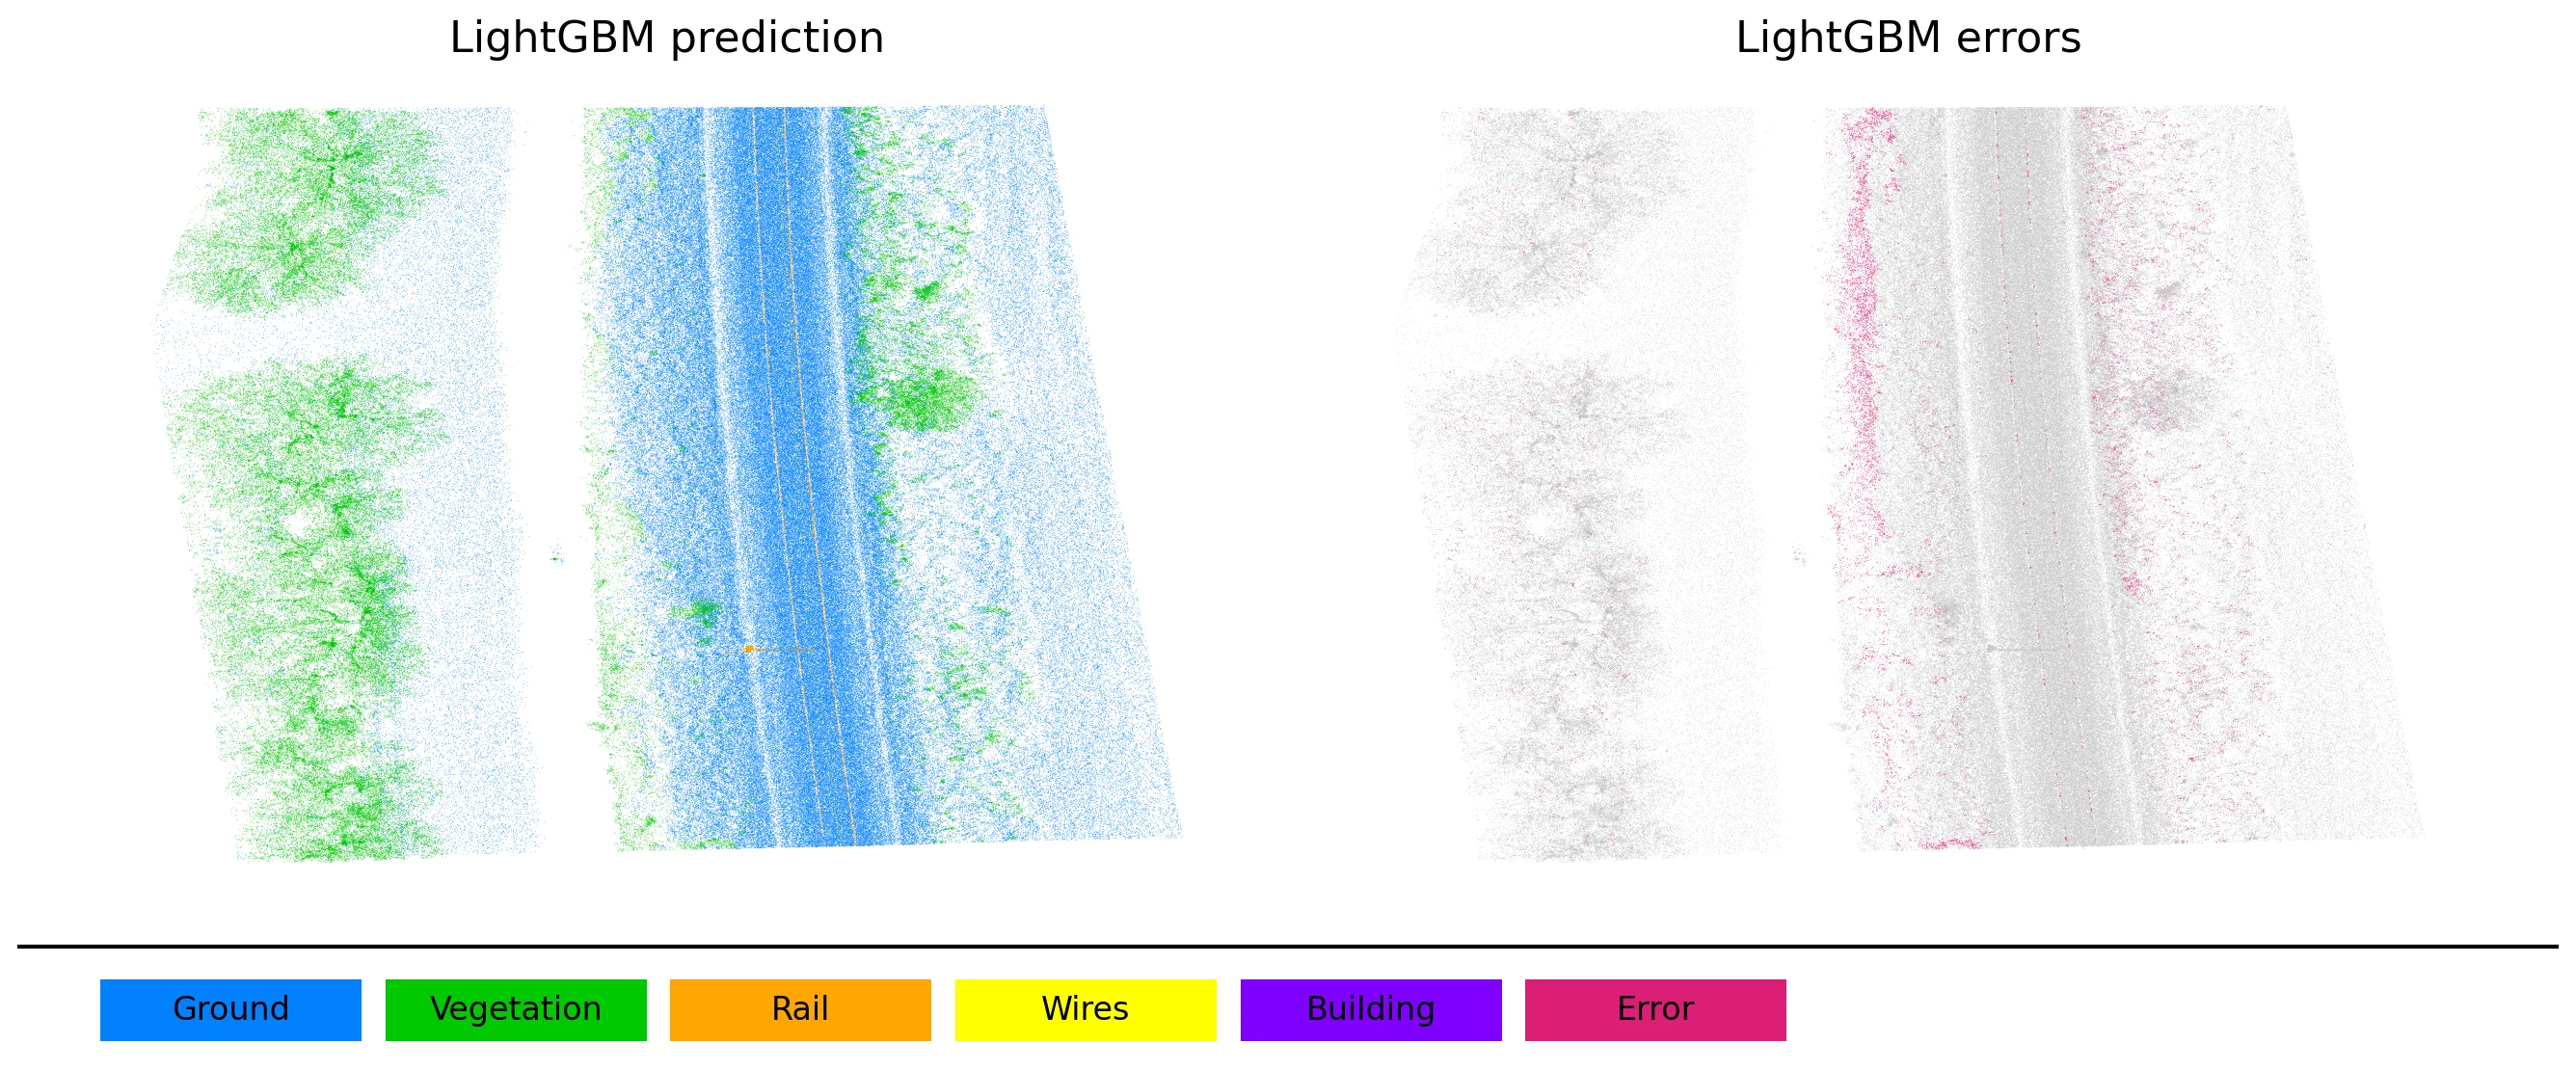
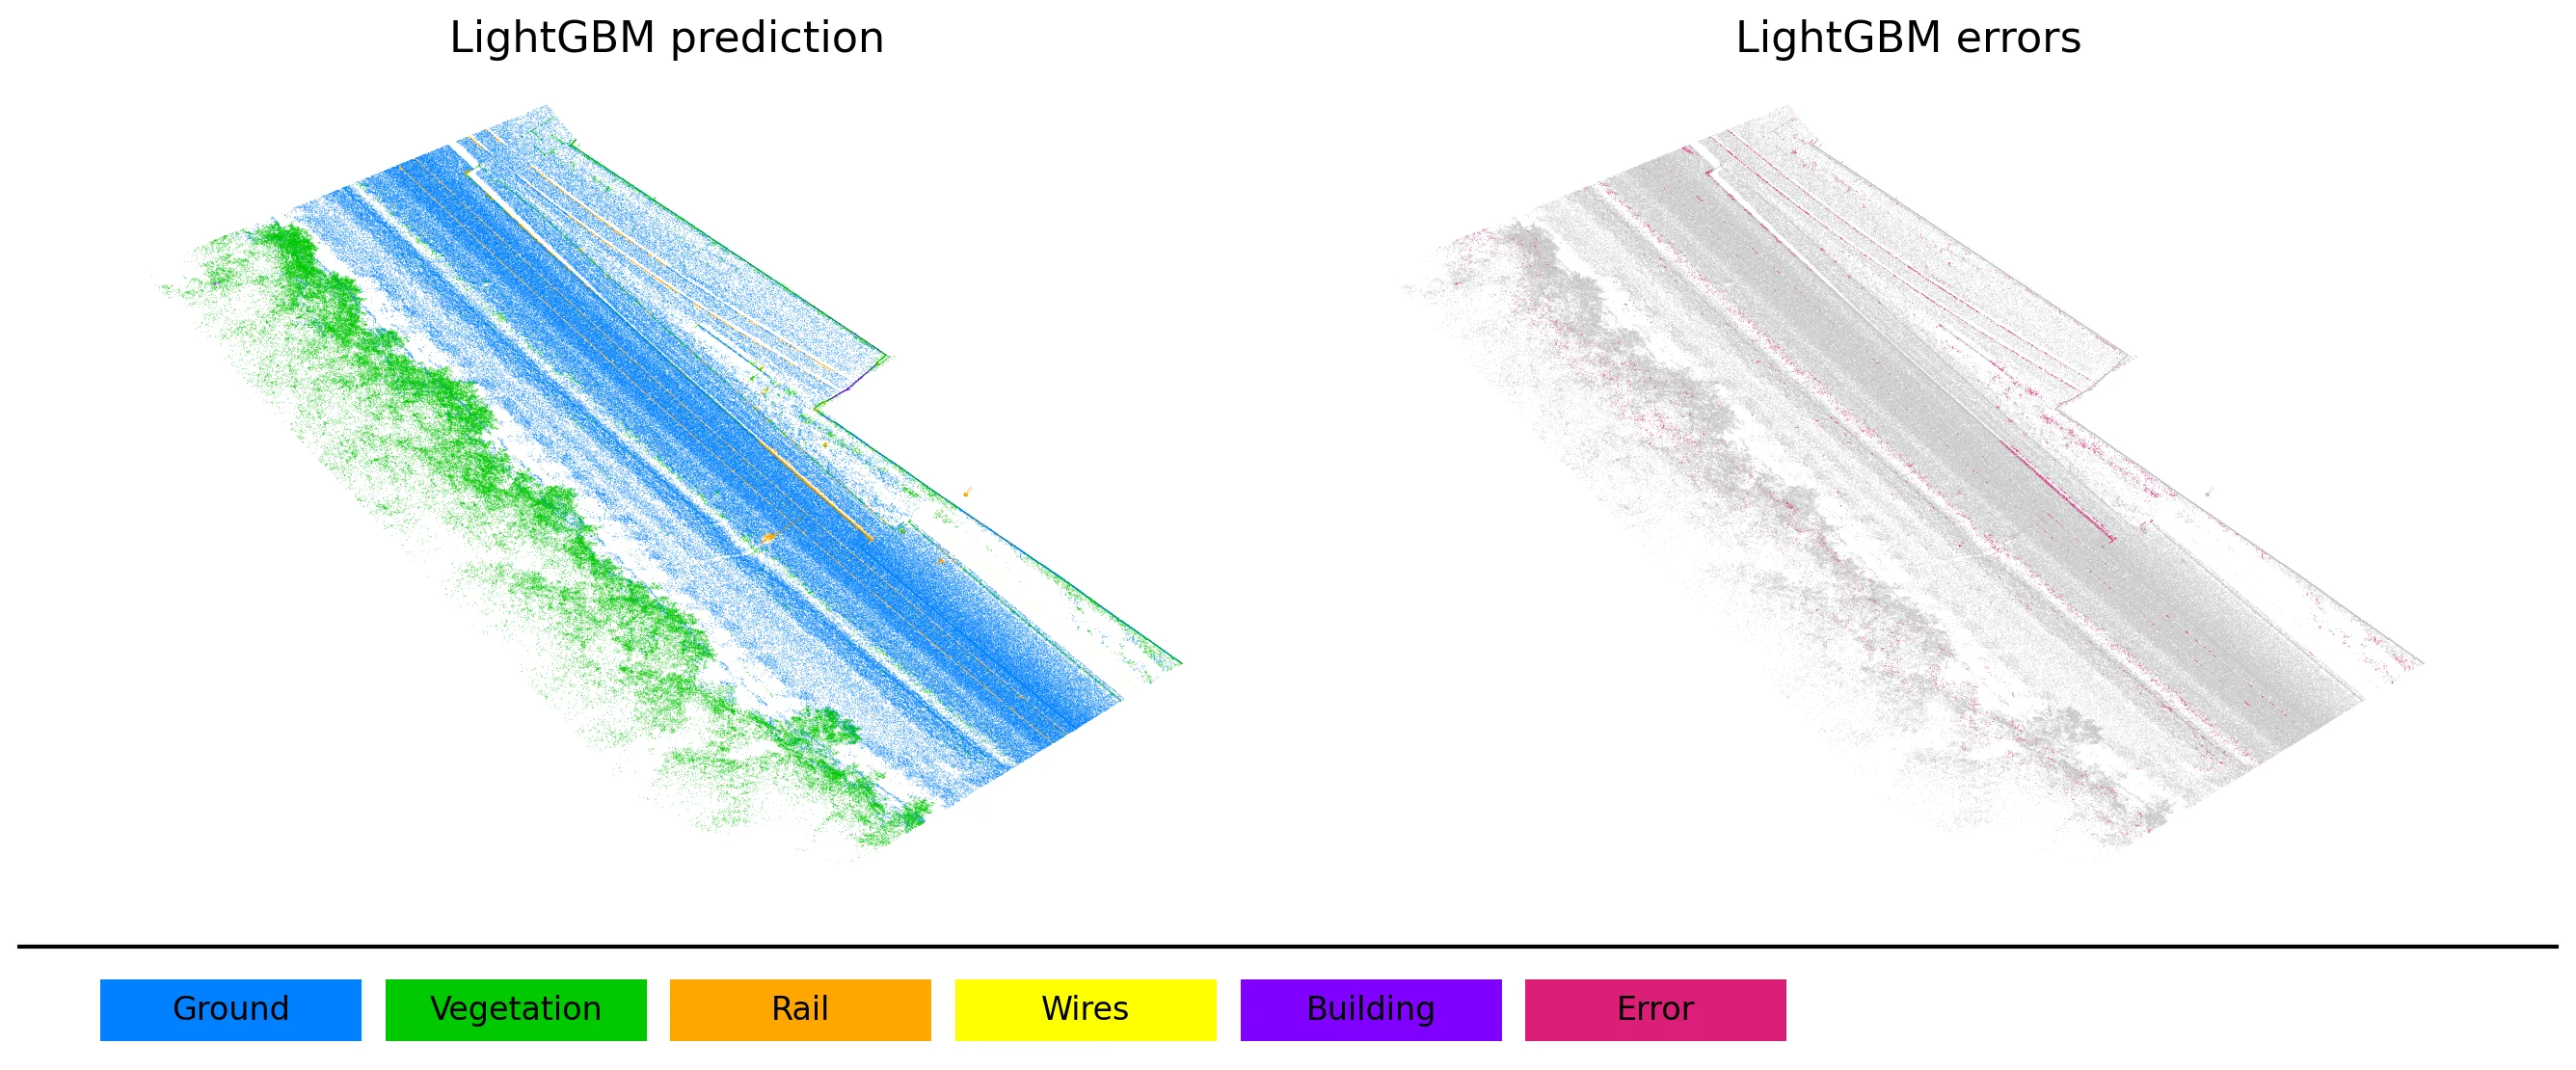
Class predictions and error views across three HMLS examples. Pink points mark incorrectly predicted regions.


HMLS_04 · LightGBM prediction and error view · Source focus5 output; pink points show errors.


HMLS_12 · LightGBM prediction and error view · Source focus5 output; pink points show errors.


HMLS_20 · LightGBM prediction and error view · Source focus5 output; pink points show errors.
- Ground
- Vegetation
- Rail
- Wires
- Building
- Error
These figures focus on ground, vegetation, rails, wires and buildings. Poles are excluded from this five-class view.
One experiment’s test record
HMLS · Test split · 3DMASC + LightGBM
- Accuracy
- 91.43%
- mIoU
- 45.39%
These values belong to the test record of runs_3dmasc_lgbm. Class scope and point count are not specified in that record. The focus5 figures above are separate outputs and are not presented as visual evidence for the same run.
04The resulting work
From data to error analysis.
- 01
3D data preparation
Experience exploring point clouds and geometric processing.
- 02
Model experiments
Research from PointNet to classification with multi-scale features.
- 03
Visible errors
Outputs that bring class predictions and incorrect points together.
- 04
Documentation
Recorded experiments, limitations and evaluation results.
A point-cloud and machine-learning study carried out during the internship. It does not claim a live LiDAR system, completed clearance verification or field deployment.