05TÜBİTAK RUTE · Image processing
Brake pad defectsegmentation.
Find the pad. Then inspect its surface. A two-stage workflow that turns an image into readable defect masks and a thickness output.
- Context
- TÜBİTAK RUTE · Internship
- Task
- Pad and defect segmentation
- Defect model
- YOLOv11l-seg
- Output
- Stain · Crack · Thickness (px)
My contribution
I annotated the data, trained and evaluated the models, and developed the full workflow from pad extraction to defect masks and result visualization.
01Data and problem
Start with the right region.
The pad occupies only a small part of the image. Stains and cracks are smaller details within that region.
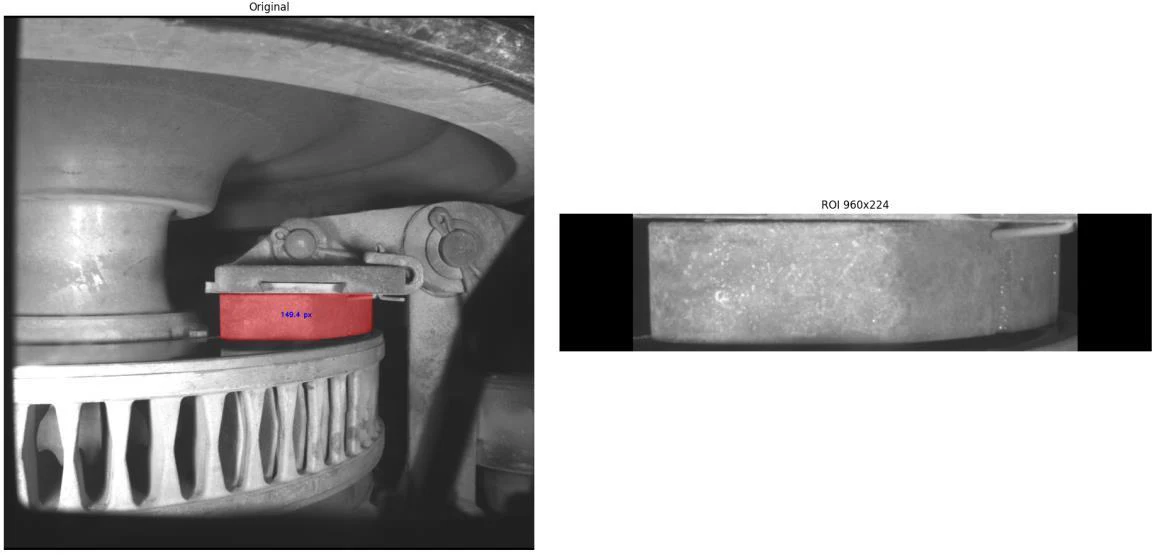
I prepared pad and defect annotations. The first model extracts a pad mask and crops the image to that region; this region of interest becomes the second model’s input.
02The processing flow
Two models. One result.
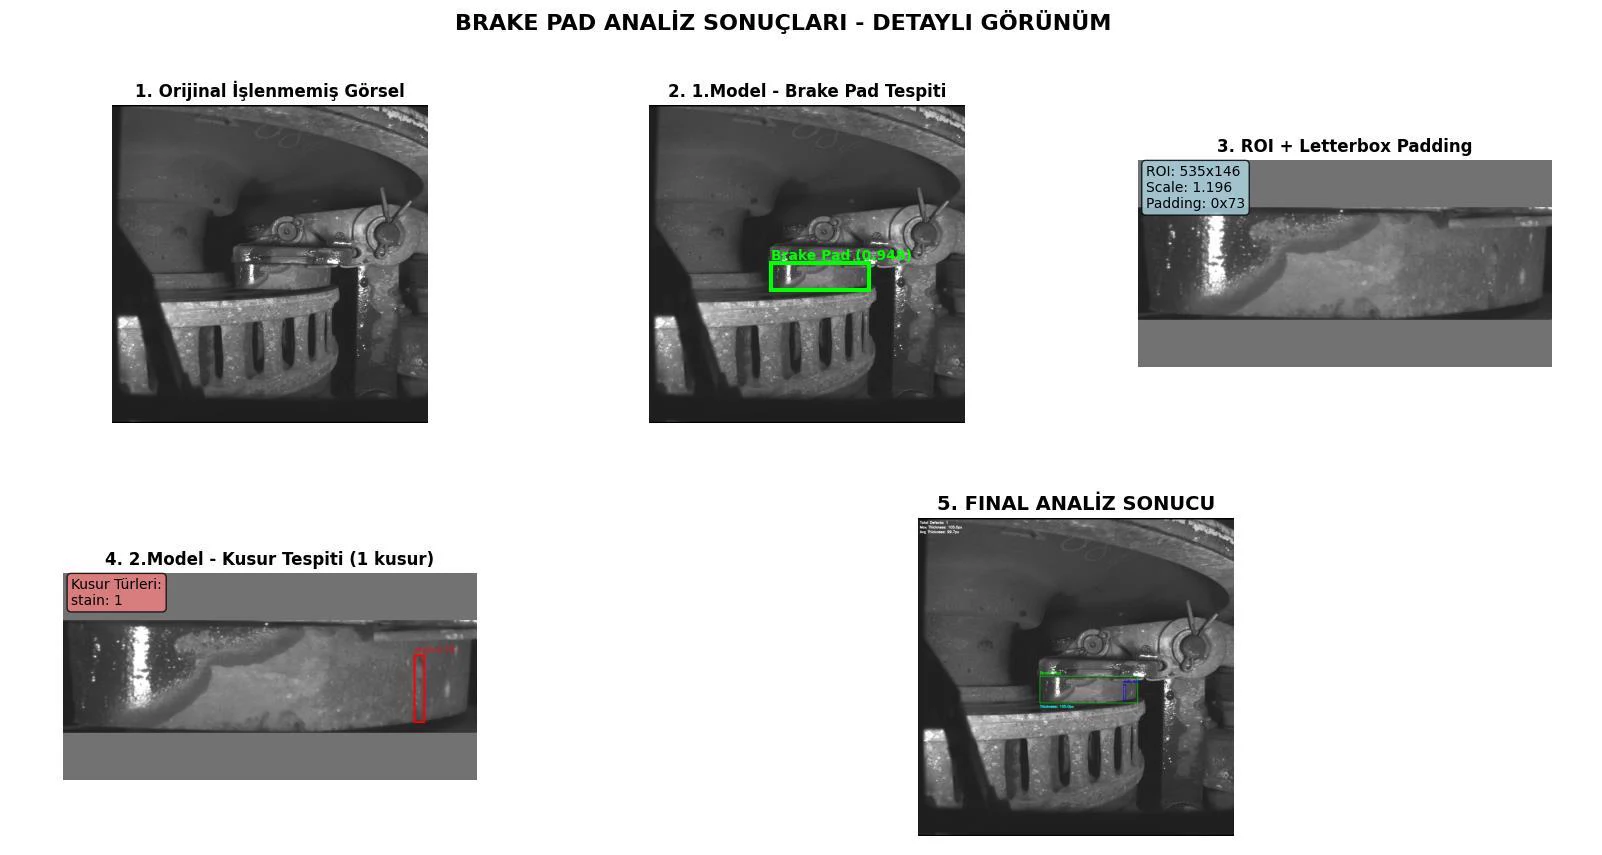
The pad mask feeds both the crop and the thickness calculation. Defect masks are mapped back to the original image coordinates.
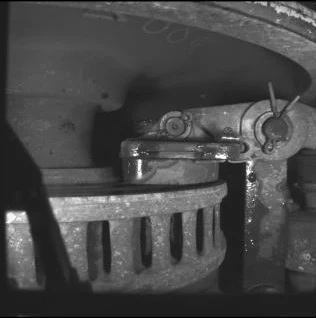
01 · Image — The original frame entering the analysis.
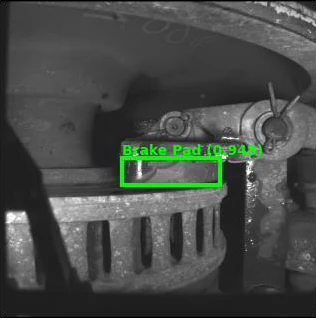
02 · Pad — The brake pad region marked by the first model.
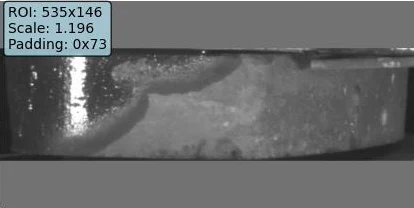
03 · ROI + Letterbox — The crop and aspect-preserving padding, with the source information box intact.
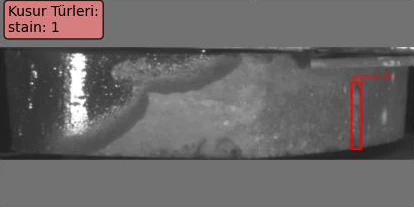
04 · Defects — The second model’s stain prediction within the ROI.
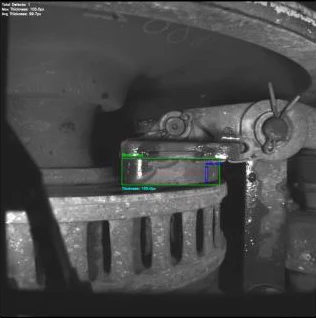
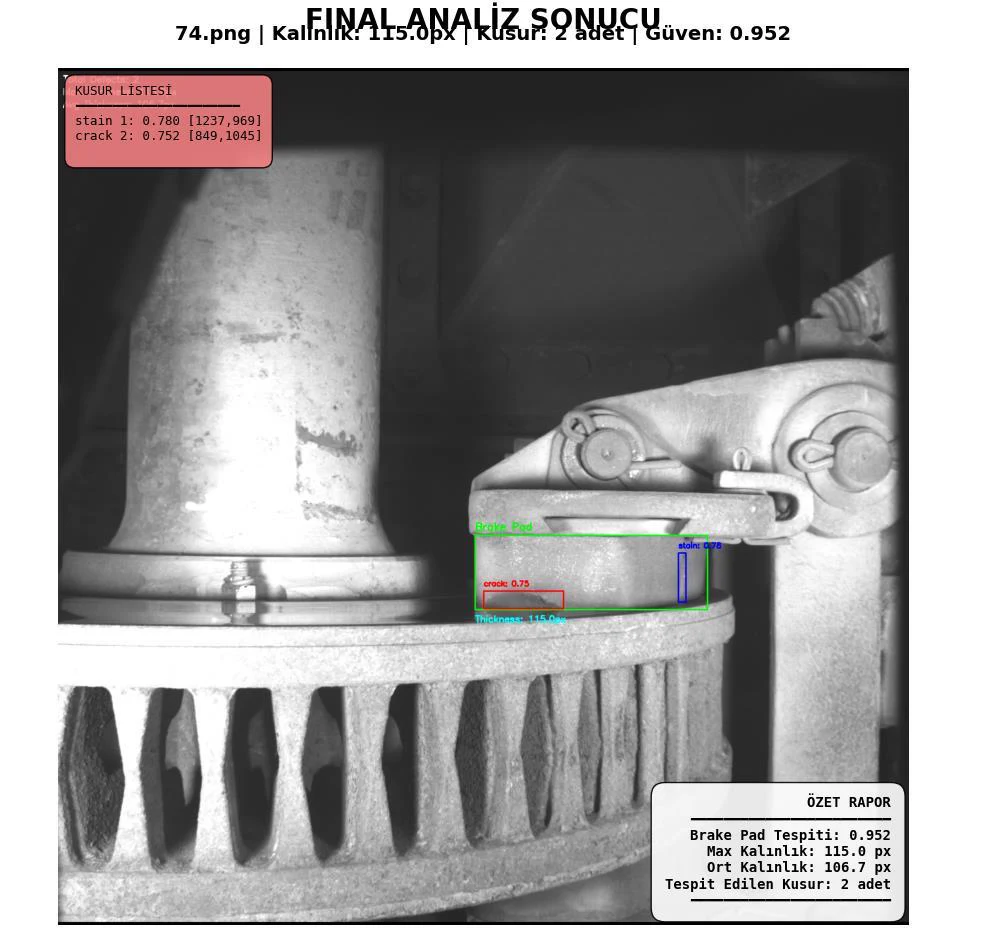
05 · Coordinates + Result — Markings mapped back to the original frame and the final output.
- ImageFull frame
- PadFirst segmentation
- ROICrop from mask
- LetterboxPreserve aspect ratio
- DefectsStain and crack masks
- CoordinatesMap to the full frame
- ResultMasks + pixel measure
03Model output
Two traces on the surface.
Stains and cracks are marked as separate classes. Predictions across different pads make the model’s output visible.
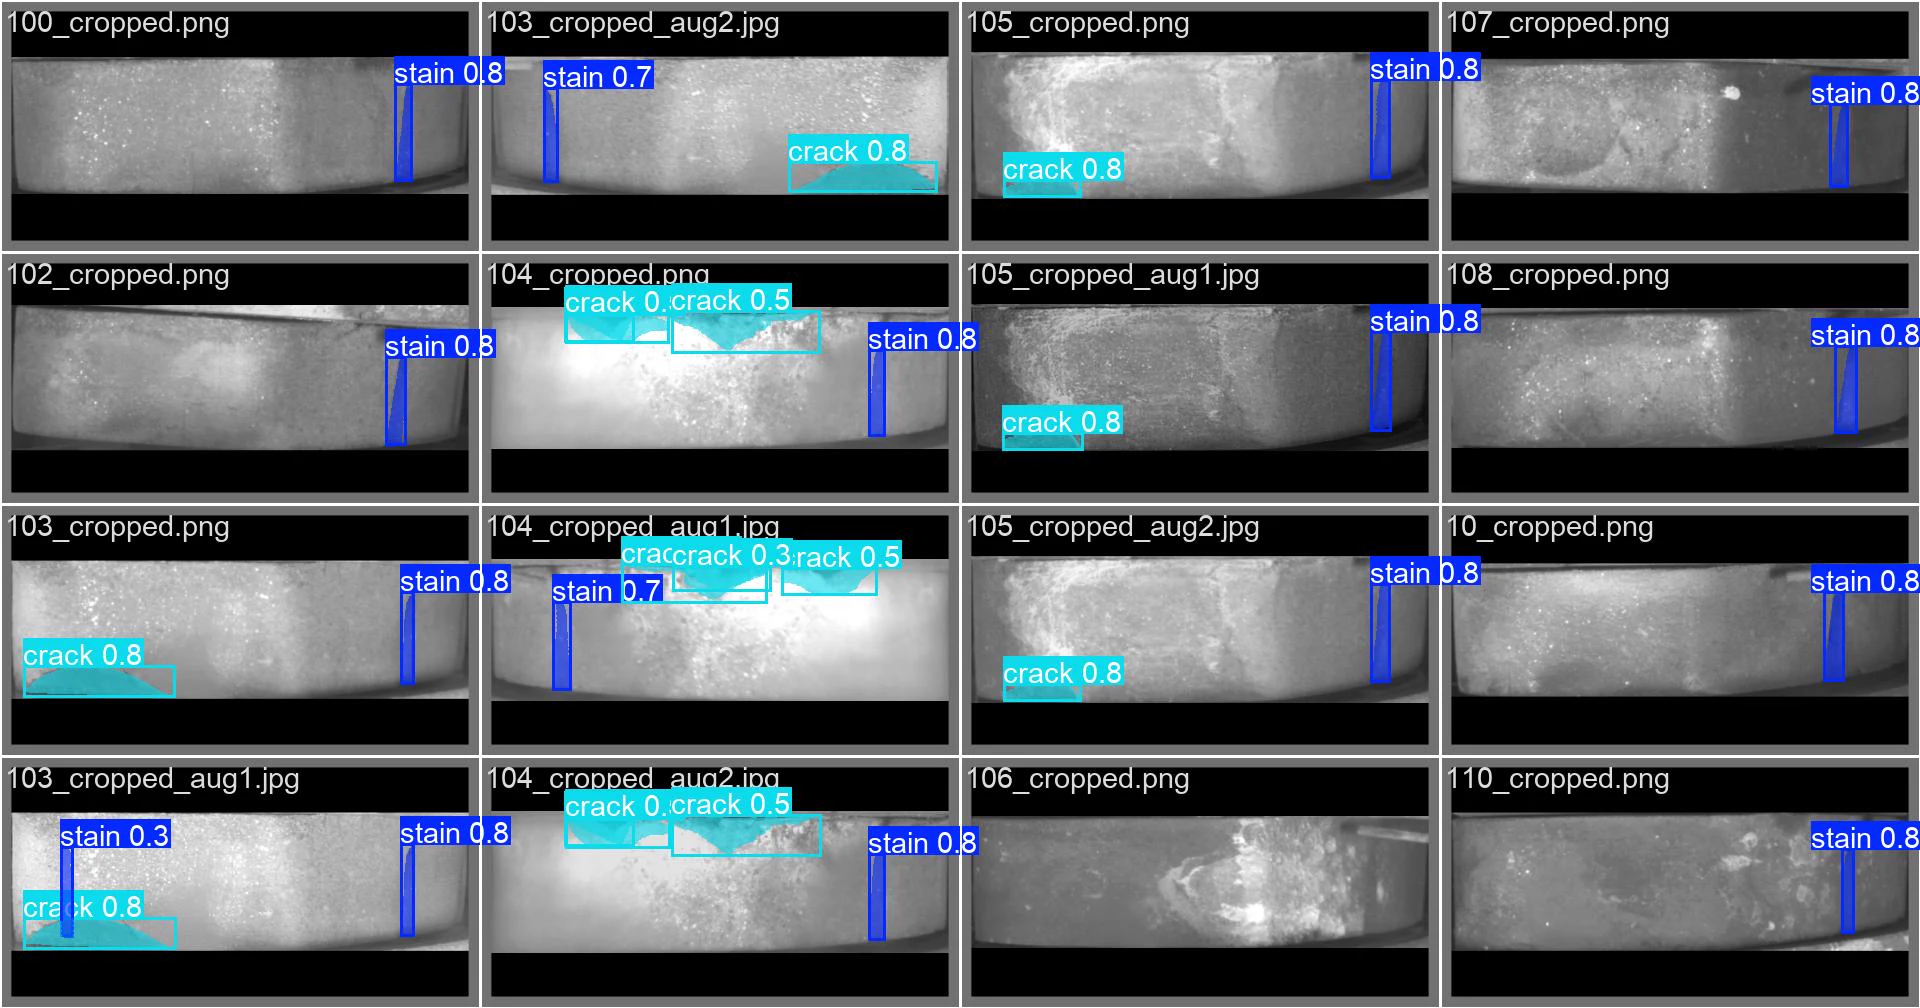
ROI defect dataset · Validation split · YOLOv11l-seg
- Mask mAP@0.5
- 90.83%
- Mask mAP@0.5:0.95
- 57.93%
These scores describe only the defect segmentation stage. They are not full-pipeline or independent test results; the report does not specify the validation image count. I split the data before augmentation, keeping all copies of each image in the same split.
04Experiments
One problem, different scales.
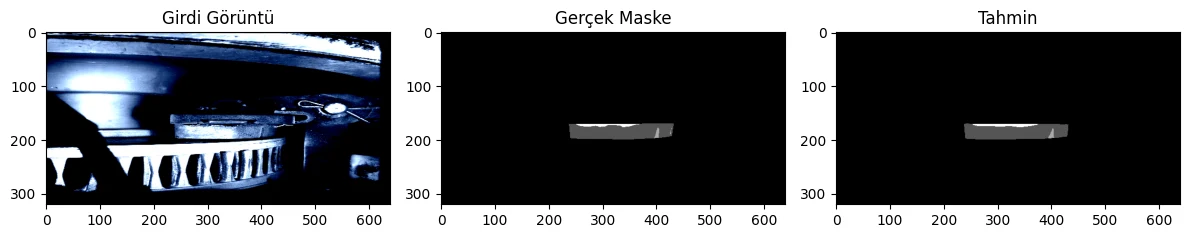
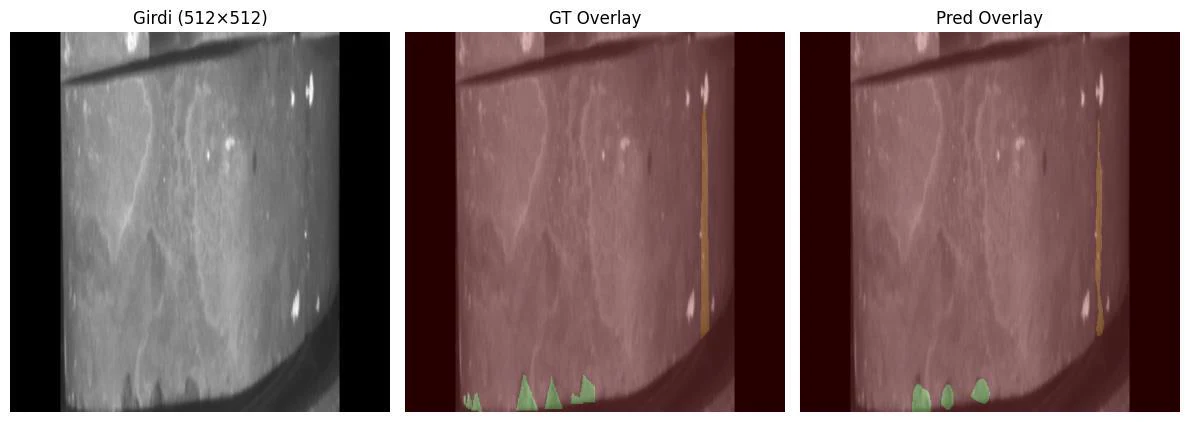
On the way to the final workflow, I explored different segmentation approaches on full images and cropped regions.
DeepLab
With DeepLab, I explored single-stage segmentation directly from the full image.
05From mask to measurement
A boundary becomes a measure.
The pad mask provides more than a location. I also used its image boundary to produce a thickness output in pixels.
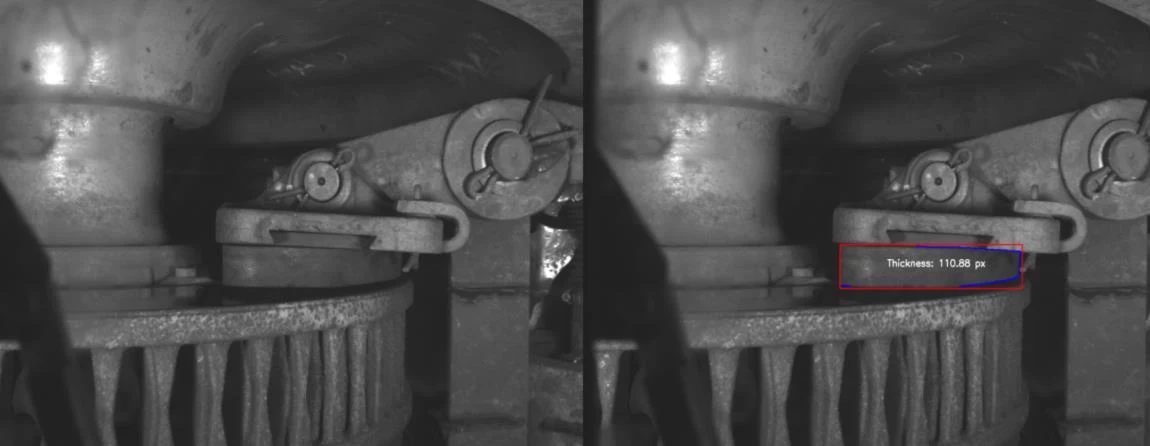
This is a prototype pixel measurement. No physical calibration, millimeter measurement or measurement-accuracy claim is made.
06The resulting work
From annotation to analysis.
- 01
Data preparation
Preparation from pad and defect annotations through to training inputs.
- 02
Model experiments
Exploration of YOLO segmentation, DeepLab and SegFormer approaches.
- 03
Two-stage workflow
Pad masks, ROI extraction, defect analysis and coordinate mapping.
- 04
Readable output
A visualization bringing defect masks and pixel measurements together.
An image-processing prototype developed during the internship. Small defects and mask boundaries remain areas for improvement; field deployment and maintenance-decision validation are outside this case’s scope.